
Measure
Time any part of the process, from one step to another, and find out which items are slow and what they have in common.
Use Measure when you want a number for one stretch of the process, such as “how long from invoice to payment?”
Use Measure to see how long one part of the process takes, and which items are slow.
The example on this page comes from the order-to-cash demo, following invoices. The question is: how long do customers take to pay after we send the invoice?
1. Open Measure
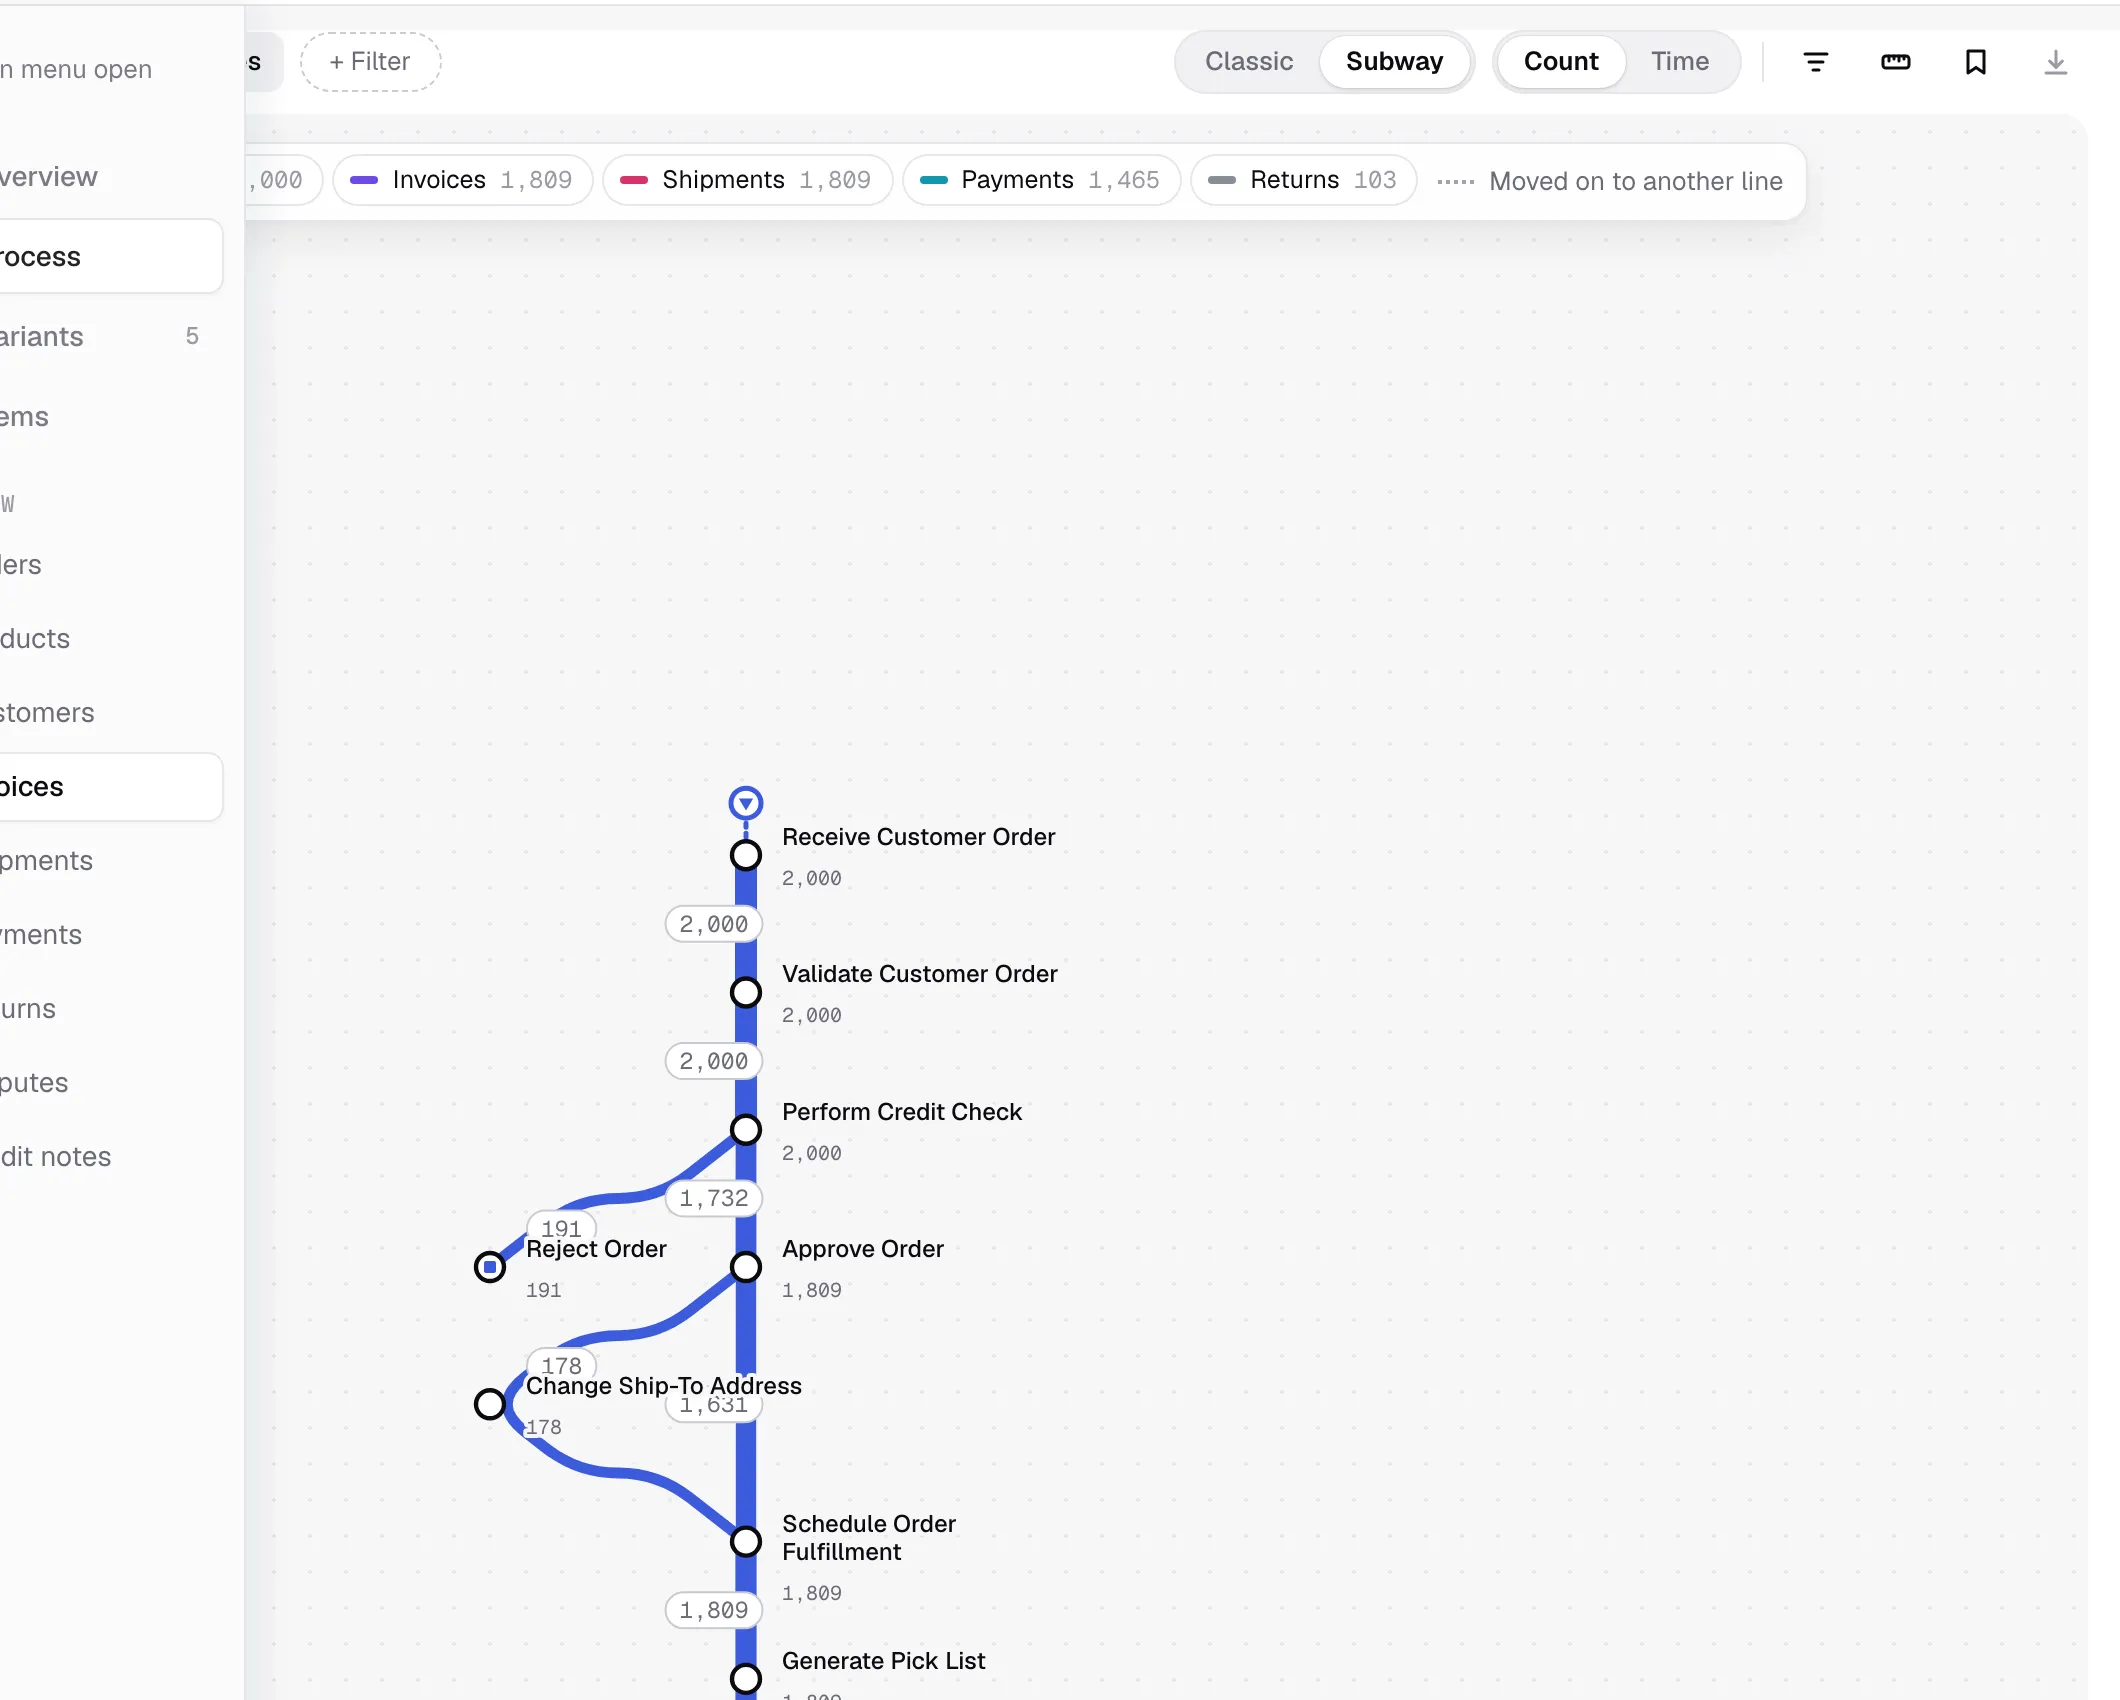
Section titled “1. Open Measure”On the Process page, select Measure time between steps (the ruler icon) in the map toolbar, or click a step and choose Measure to…. The panel opens on the right.
Three buttons at the top choose what gets timed:
| Button | Times… | Example question |
|---|---|---|
| Start to end | each item’s whole life | How long is an invoice open, start to finish? |
| Between steps | from step A to step B | How long from sending the invoice to getting paid? |
| Linked | from a step on one kind of record to a step on another | From receiving the order to its invoice being paid |
Linked only appears for connected data.
2. Pick the two steps
Section titled “2. Pick the two steps”Choose Between steps, then click the starting step on the map and the ending step. You can also pick them from the From and To lists. The map marks them with a blue A and B.
3. Read the answer
Section titled “3. Read the answer”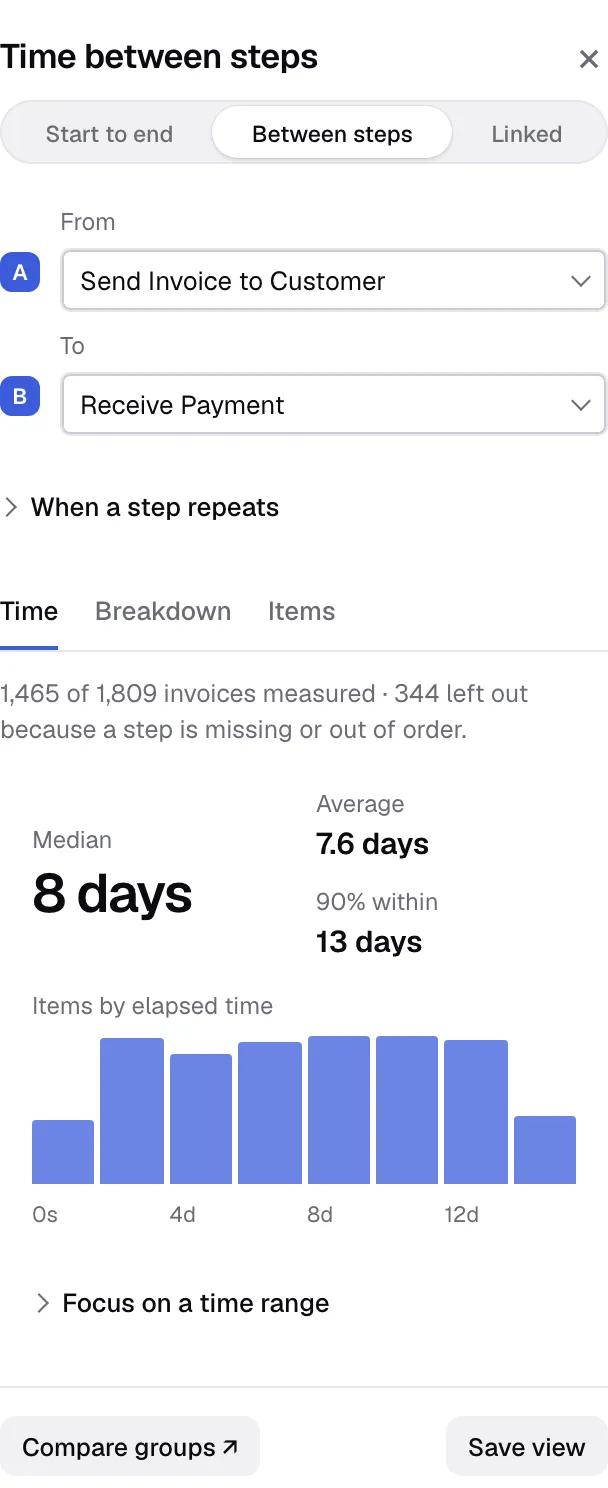
- 1,465 of 1,809 invoices measured, 344 left out. Only invoices with both A and B can be timed. The 344 were never paid, so there is no B.
- Median 8 days. Half are paid within 8 days, half take longer. This is the typical figure.
- Average 7.6 days. The plain average. A few extreme items can pull it up or down.
- 90% within 13 days. Nine out of ten are paid within 13 days. This shows how bad the slow end gets.
- The bars. Each bar is a time band. A long tail to the right means some items are very slow.
Times are clock time, not hands-on work. A step that waits over a weekend counts the weekend.
4. When a step repeats
Section titled “4. When a step repeats”Leave this alone unless A or B can happen more than once to the same item, such as an invoice sent twice. You choose whether the clock starts at A’s first or last time, and stops at B’s first or last time. The default, first A to last B, gives the full span.
5. Look at the slow ones
Section titled “5. Look at the slow ones”Click a bar, or open Focus on a time range and type a range such as “more than 10 days”, then select Show items in range.
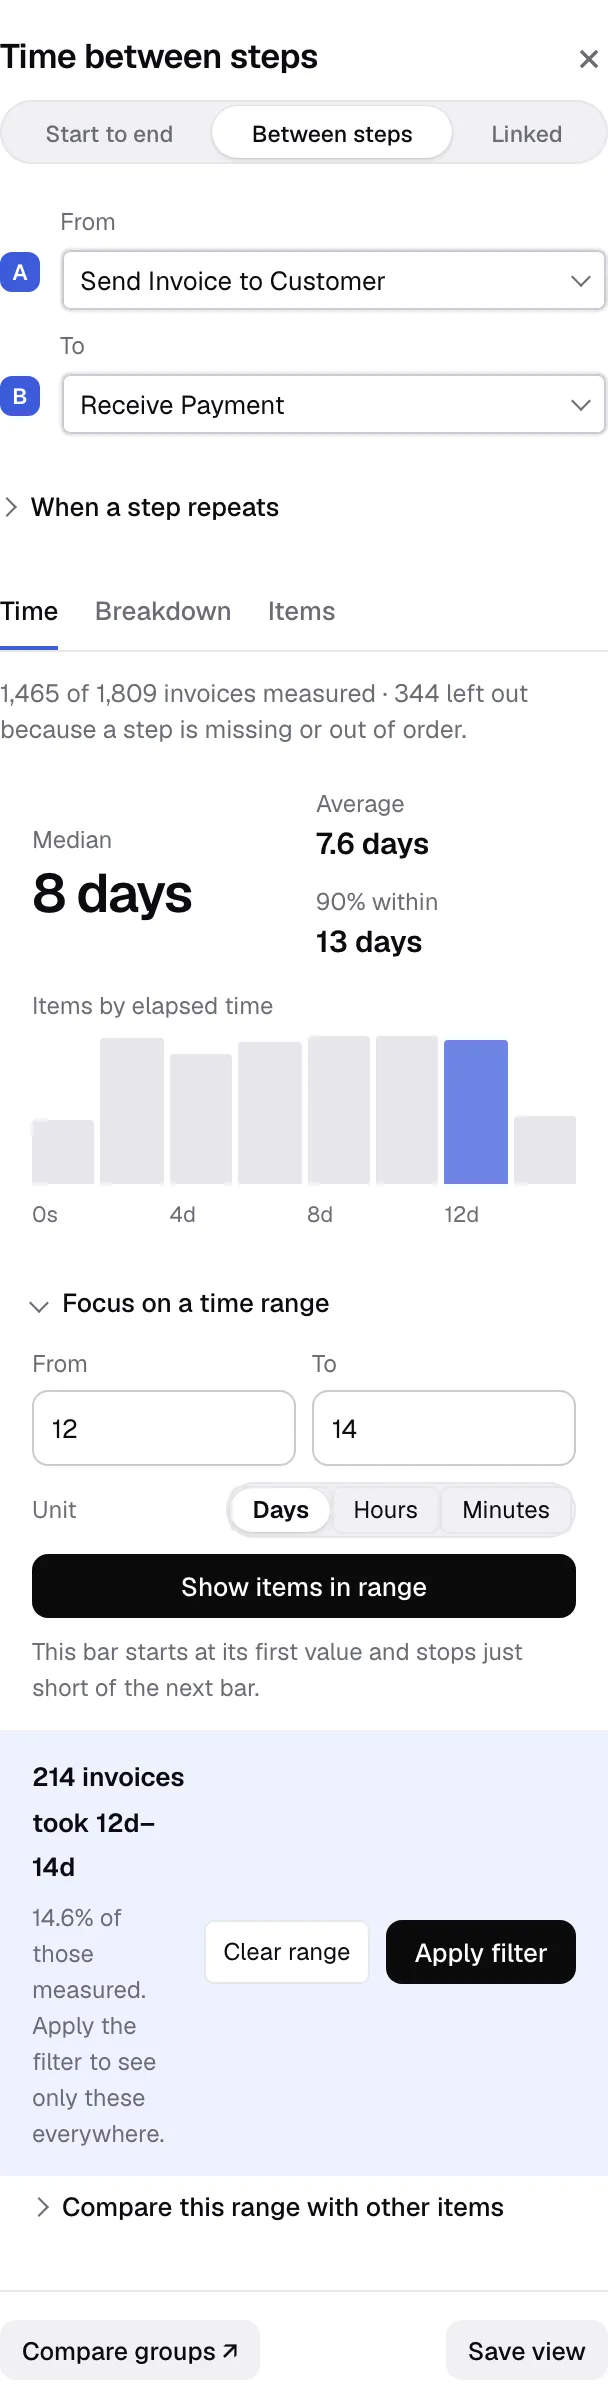
The blue box gives the count. Then:
- Apply filter keeps only these items on every page. It shows as a chip you can remove.
- Clear range forgets the selection.
6. What is different about these?
Section titled “6. What is different about these?”Under Compare this range with other items, glasstarn lists steps that are more or less common in your picked group than in the rest.
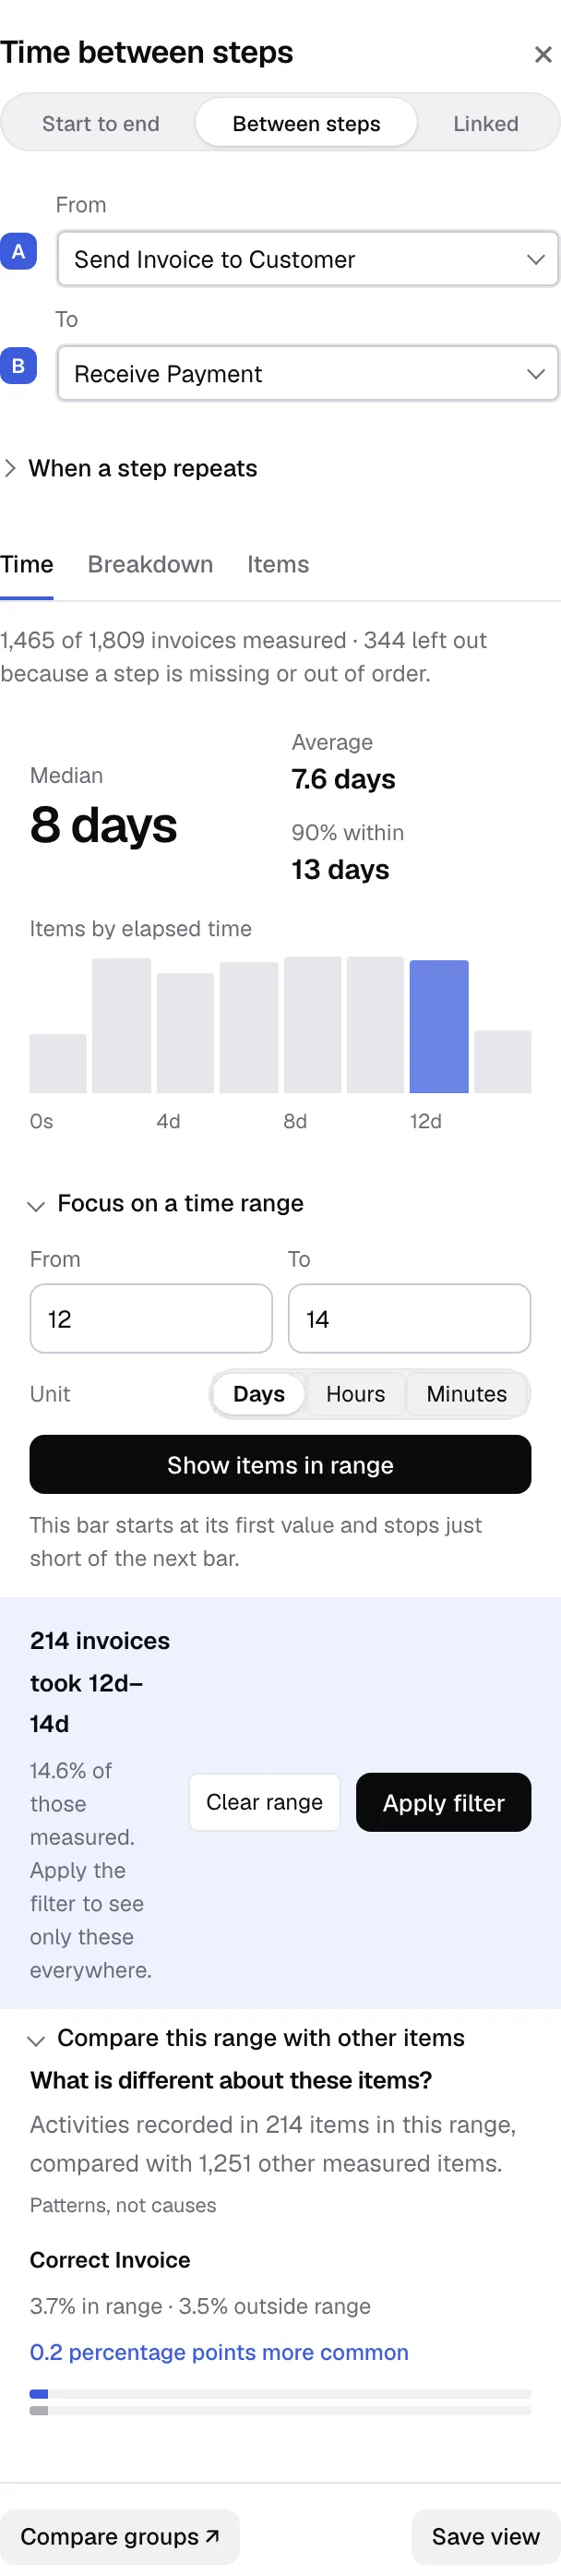
Here Correct Invoice is on 3.7% of the slow invoices and 3.5% of the others. That is barely different, so it does not explain the delay. These are patterns, not causes. Use them to decide what to look into.
7. Break it down by a field
Section titled “7. Break it down by a field”The Breakdown tab splits the same time by a field you choose, such as region or vendor. Each group gets a bar with its median. You can switch to average, 90% or count.
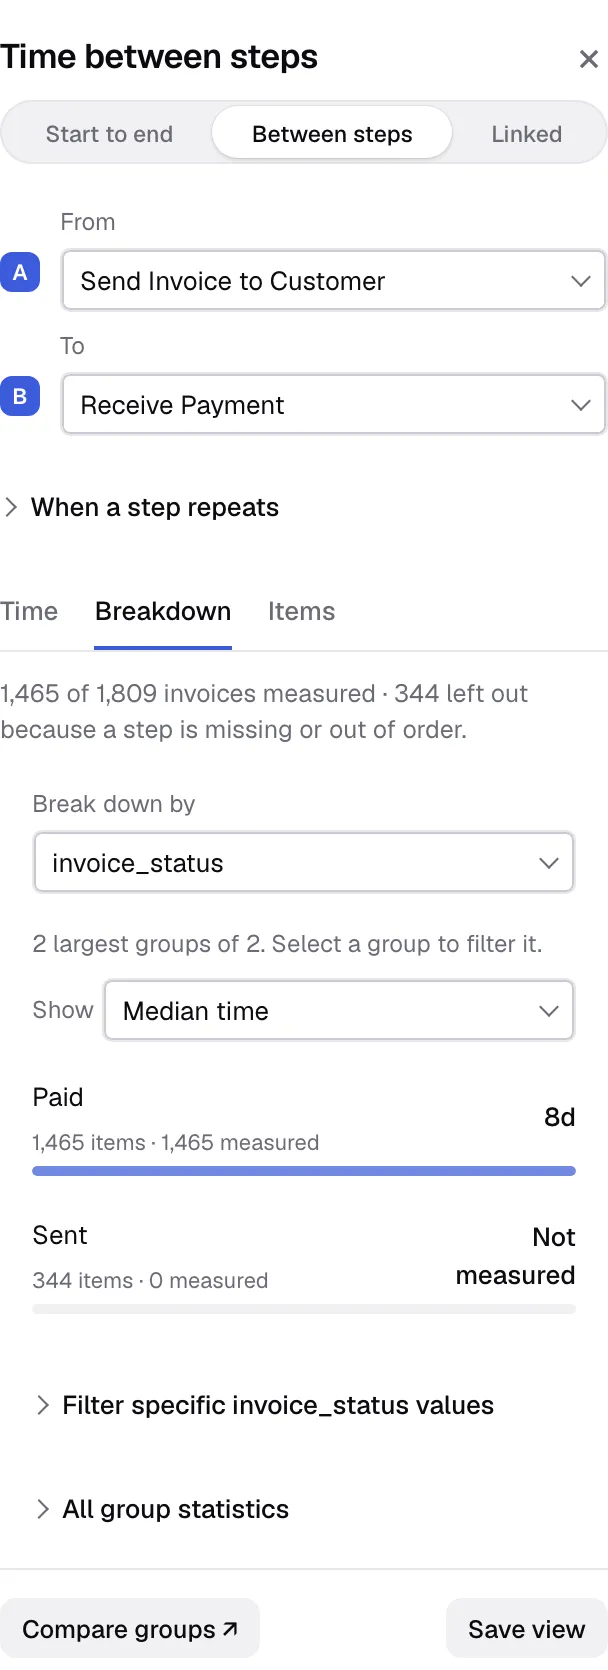
Filter specific values lets you tick groups and select Use selected values to keep only those items. All group statistics shows the same numbers as a table.
8. Items, and how it is measured
Section titled “8. Items, and how it is measured”The Items tab has:
- Example items you can click to see their full history.
- How this is measured, the rules in plain words: clock time, each item counted once, items missing A or B left out.
- Slowest items and where they wait, in Start to end mode only.
9. Linked mode
Section titled “9. Linked mode”The same idea as Between steps, but A and B can be on different kinds of records. For example, A is Receive Customer Order on the order and B is Receive Payment on its invoice. That is order-to-cash across documents.
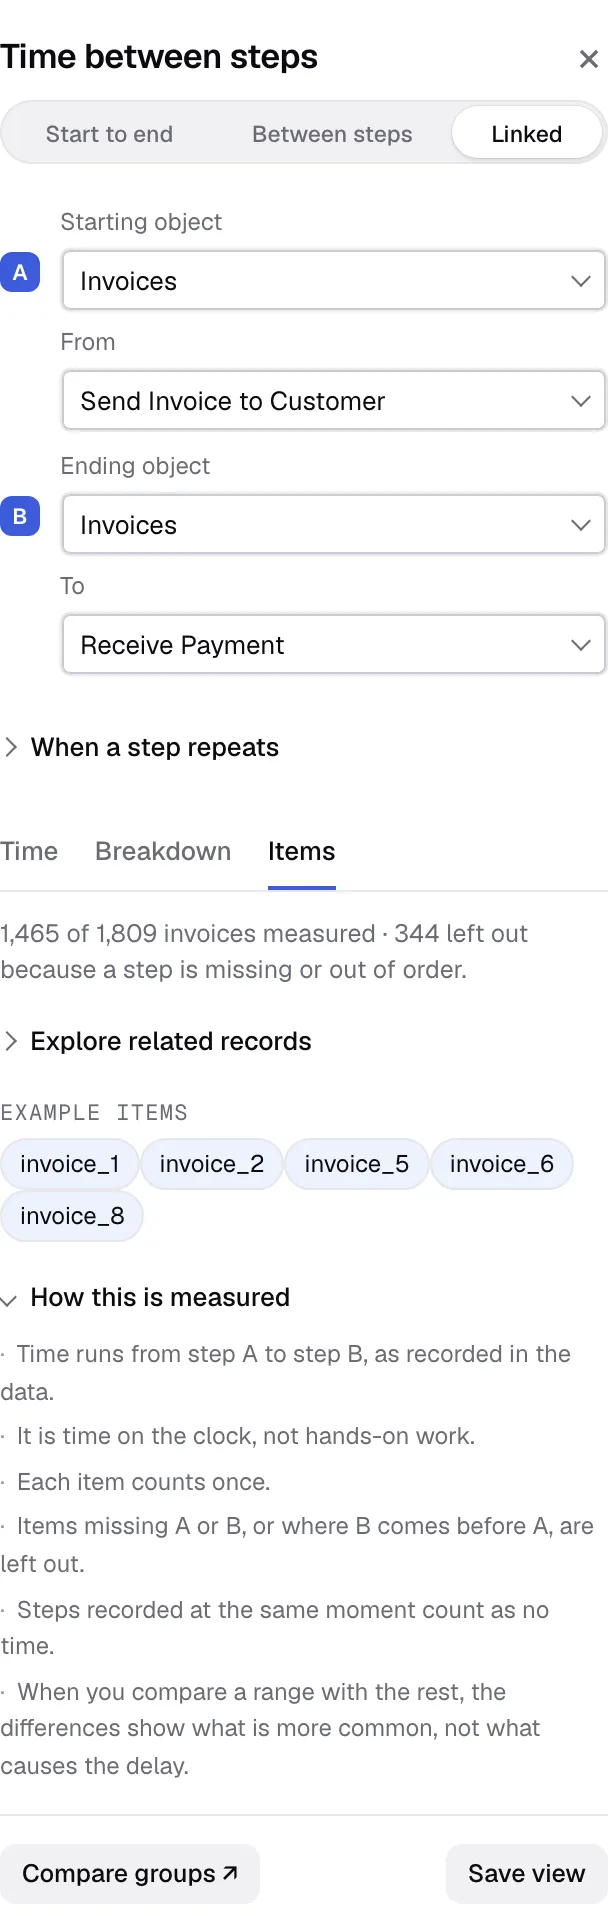
Explore related records on the Items tab jumps from a selection, such as the slow invoices, to the records linked to them, such as their orders.
The two buttons at the bottom
Section titled “The two buttons at the bottom”- Compare groups opens the Compare page, another way to put two groups or two time periods side by side.
- Save view saves the question (A, B, range, field) in the project. Reopen it from the bookmark icon.
Summary
Section titled “Summary”- Choose what to time: Start to end, Between steps or Linked.
- Read the median and the 90% figure.
- Click a bar to pick the slow items, then filter to them or see what is different about them.